Market Update for the Month Ending May 31, 2018
June 6, 2018
Mixed May for markets
U.S. equities and fixed income rallied in May while foreign stocks declined. The Dow Jones Industrial Average was up 1.41 percent, the S&P 500 Index gained 2.41 percent, and the Nasdaq popped 5.50 percent.
Better-than-expected fundamentals supported returns. According to FactSet, as of May 25, with 97 percent of companies reporting, the blended earnings growth rate for the S&P 500 was 24.6 percent—the highest level in nearly eight years. This shows the positive effects that tax reform is having on corporate earnings. Technicals were strong as well, with all three major U.S. indices staying above their 200-day moving averages for the month.
The story played out differently for international markets. The MSCI EAFE Index dropped 2.25 percent in May, as European politics and trade worries weighed on investors. The MSCI Emerging Markets Index declined 3.52 percent on concerns over Federal Reserve (Fed) tightening and a strong dollar.
Signs of economic growth also grew weaker around the world. As international fundamentals slowed, technical support decayed. Both international indices fell below their respective 200-day moving averages. This is not an immediate cause for concern, but it bears watching, as it could signal the beginning of a downward trend.
Fixed income had a solid May. U.S. interest rates rose early in the period but ended lower as rising political risks sparked a global flight to safety. The yield on the 10-year U.S. Treasury started at 2.97 percent, rose to 3.11 percent, and finished at 2.83 percent. This left the Bloomberg Barclays U.S. Aggregate Bond Index with a gain of 0.71. Corporate high-yield bonds, which are less tied to interest rate moves, declined 0.03 percent on growing credit concerns.
Strong month for economic news
May was a solid month for economic data. Consumers and businesses remained confident about the economy, with consumer confidence, as measured by the Conference Board, rebounding to one of its highest readings in 18 years.
A strong labor market also bolstered consumer confidence. The economy added 233,000 new jobs in May, and the unemployment rate fell to 3.8 percent.
Turning to business, the Institute for Supply Management’s Manufacturing and Nonmanufacturing indices were at levels that, historically, have indicated annual gross domestic product growth of more than 3 percent. This suggests that growth is likely to accelerate. In fact, at month-end, the Federal Reserve Bank of Atlanta forecast second-quarter growth of around 4 percent.
Spending fuels growth
Strong consumer and business spending seems to be bolstering the economy. Core retail sales grew at a steady 0.3-percent pace in April, and March’s figure was revised up to 0.4 percent.
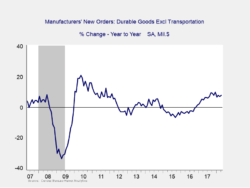
Business investment bounced back in April, following a slight decline in March. Core durable goods orders, which serve as a proxy for business investment, grew an impressive 0.9 percent. As seen in Figure 1, this measure has rebounded following a slowdown in 2015 and 2016.
Figure 1. U.S. Core Durable Goods Orders, 2007−2018
But not all of the news was good. Housing, in particular, showed signs of slowing. Despite positive industry sentiment, buyers continue to wrestle with low supply and rising mortgage rates. These factors resulted in declines in new and existing home sales of 1.5 percent and 2.5 percent, respectively.
Further, decreases in housing starts and building permits indicate that supply constraints may last a while, even as rising interest rates cut into demand. This is an area to watch, although the slowdown may well be temporary.
Overall, the economy continues to improve. In fact, markets expect the Fed to raise the federal funds rate by 25 basis points at its June meeting.
Political risks take center stage
As economic risks appeared to subside, political risks returned here and abroad. International markets dropped as the prospect of a euroskeptical government in Italy became imminent, raising the chances of a new threat to the European Union (EU) and euro.
In the U.S., the primary political concerns were North Korea and trade. The major questions revolve around the on-again, off-again summit meeting. Although the possibilities for progress are real, the fluid nature of the proposals has kept markets guessing.
On the trade front, at month-end, the U.S. imposed tariffs on steel and aluminum from Mexico, the EU, and Canada. All three entities have announced retaliatory tariffs on a wide range of goods. These actions could be the first salvos in a larger trade war.
Economy bright, growth should continue
U.S. markets shrugged off rising political concerns in May, serving up solid gains backed by a solid economy and strong corporate performance. Given the potential triggers to volatility that we experienced last month, it is a very encouraging sign that all three major indices were up.
That said, risks remain. The political headwinds could start to rattle markets. Rising prices and interest rates, along with a potential slowdown in housing, could lead to volatility. As always, a well-diversified portfolio that matches your goals is the best way to prepare for the future.
All information according to Bloomberg, unless stated otherwise.
Disclosure: Certain sections of this commentary contain forward-looking statements based on our reasonable expectations, estimates, projections, and assumptions. Forward-looking statements are not guarantees of future performance and involve certain risks and uncertainties, which are difficult to predict. Past performance is not indicative of future results. Diversification does not assure a profit or protect against loss in declining markets. All indices are unmanaged and investors cannot invest directly into an index. The Dow Jones Industrial Average is a price-weighted average of 30 actively traded blue-chip stocks. The S&P 500 Index is a broad-based measurement of changes in stock market conditions based on the average performance of 500 widely held common stocks. The Nasdaq Composite Index measures the performance of all issues listed in the Nasdaq Stock Market, except for rights, warrants, units, and convertible debentures. The MSCI EAFE Index is a float-adjusted market capitalization index designed to measure developed market equity performance, excluding the U.S. and Canada. The MSCI Emerging Markets Index is a market capitalization-weighted index composed of companies representative of the market structure of 26 emerging market countries in Europe, Latin America, and the Pacific Basin. It excludes closed markets and those shares in otherwise free markets that are not purchasable by foreigners. The Bloomberg Barclays Aggregate Bond Index is an unmanaged market value-weighted index representing securities that are SEC-registered, taxable, and dollar-denominated. It covers the U.S. investment-grade fixed-rate bond market, with index components for a combination of the Bloomberg Barclays government and corporate securities, mortgage-backed pass-through securities, and asset-backed securities. The Bloomberg Barclays U.S. Corporate High Yield Index covers the USD-denominated, non-investment-grade, fixed-rate, taxable corporate bond market. Securities are classified as high-yield if the middle rating of Moody’s, Fitch, and S&P is Ba1/BB+/BB+ or below.
###
Kevin Moore, CFP®, AIF® is a financial advisor and CERTIFIED FINANCIAL PLANNER™ at i*financial located at 1901 NW Military Hwy Ste. 102, San Antonio, TX 78216. He offers securities and advisory services as an Investment Adviser Representative of Commonwealth Financial Network®, Member FINRA/SIPC, a Registered Investment Adviser. He can be reached at 210-342-4346 or by email at kevin@youandifinancial.com.
Authored by Brad McMillan, CFA®, CAIA, MAI, managing principal, chief investment officer, and Sam Millette, fixed income analyst, at Commonwealth Financial Network®.
© 2018 Commonwealth Financial Network®